
Prometheus disk I/O metrics
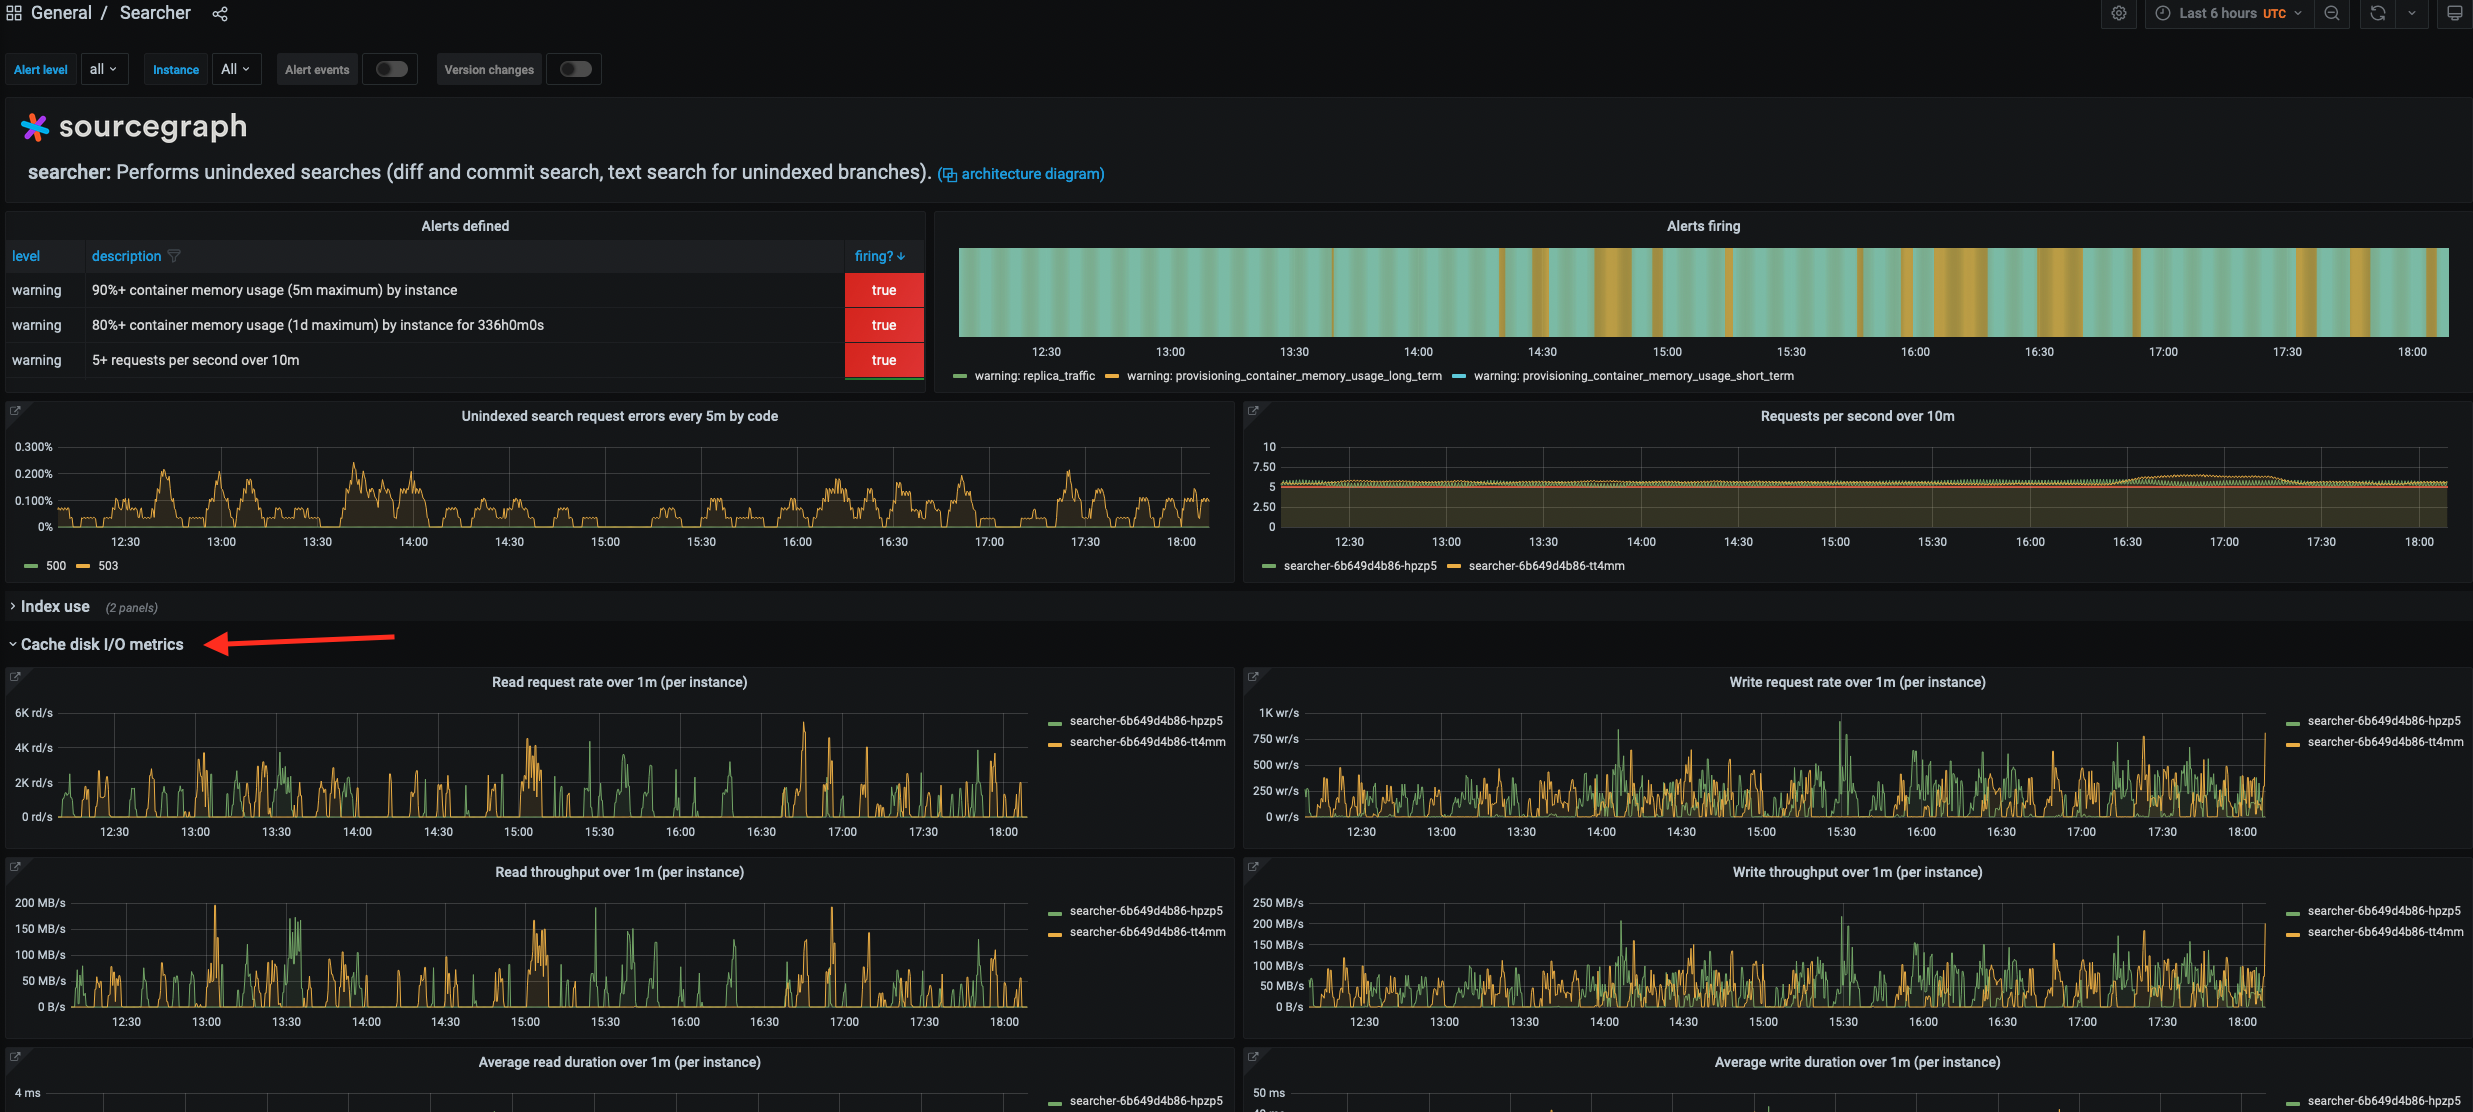
As of Sourcegraph 4.2.0, we’ve added detailed disk I/O Prometheus metrics for the Zoekt, Git Server, and Searcher services. You can find these under the “Disk I/O metrics” section of each service’s Grafana dashboard.
Keep in mind that these metrics are new, so we don’t yet have a baseline for what “healthy” disk metrics look like. Additionally, a given disk metric’s interpretation can vary depending on the environment. This can be due to factors such as the instance’s disk configuration (e.g. SSD vs. HDD, different classes of SSD, etc.) and the workload for the given Sourcegraph instance.
Typically, we want to establish the trend for these metrics over time for a given deployment. After that, any deviations from that trend (due to workload spikes, buggy new Sourcegraph release, etc.) are the things to pay attention to.
We added these metrics because we didn’t have enough visibility into disk I/O performance in our monitoring stack. Disk I/O is slow compared to RAM access and can be a potential source of performance issues for I/O-intensive services.
These metrics can help in situations like the following:
-
See if disk saturation, contention, etc. are the source of some “slowness” for these services. For example, if the average read request takes a long time to resolve, it may indicate that the disk is saturated.
-
Determine our “baseline” disk IOPS requirements for a given workload. For example, if a load test reveals that a service peaked at a certain number of reads per second, we should configure that service’s disk that can support at least that many IOPS to ensure adequate performance.
-
Determine how to scale a service (horizontally or vertically). For example, if a service’s read / write request load is approaching the maximum IOPS capacity of the disk it is using, it may be necessary to add more replicas to distribute the load across multiple disks.
For more information about the implementation of these metrics, see the following pull requests on GitHub:
For more information on how to interpret these metrics, see our monitoring reference, as well as the following resources:
- This blog
- The
iostatman page